Monitor Flows
Flows include comprehensive charts, metrics, and integrations to help you track and manage your data ingestion.
Observability in the Onehouse Console
Find problematic Flows
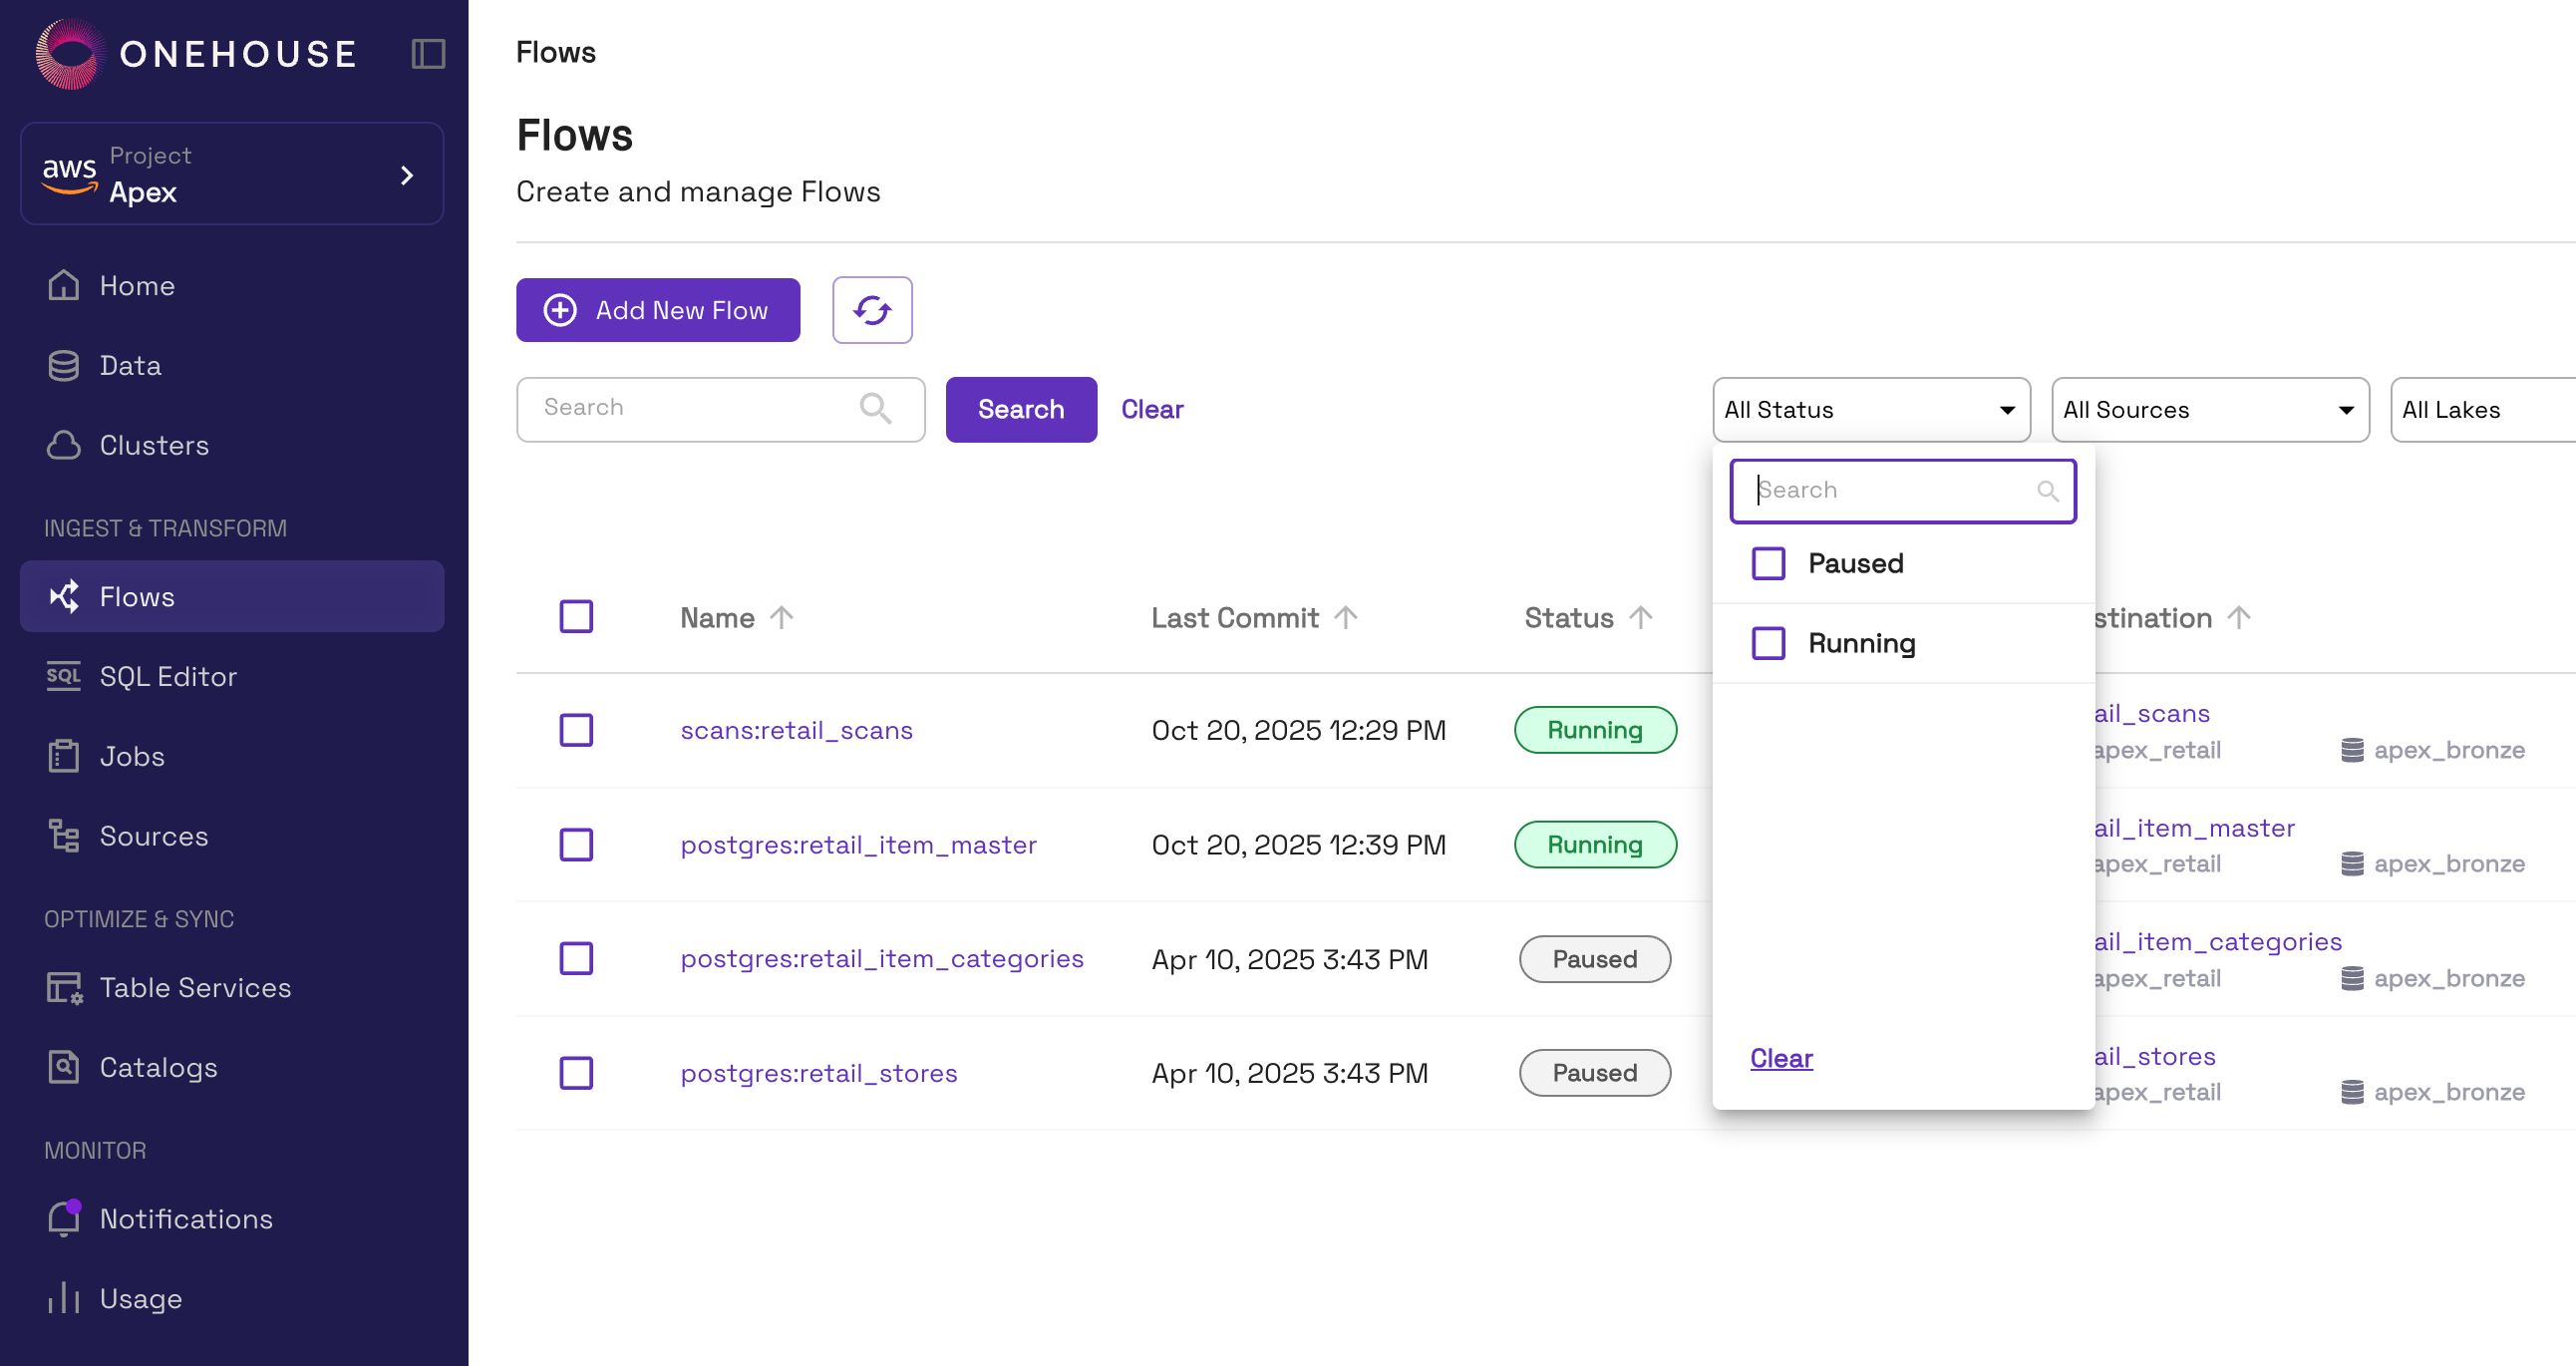
Open the Flows page to view all Flows. You can filter by status to examine Flows that are Failed or Delayed.
Flow-level charts and metrics
Click into a Flow for rich observability.
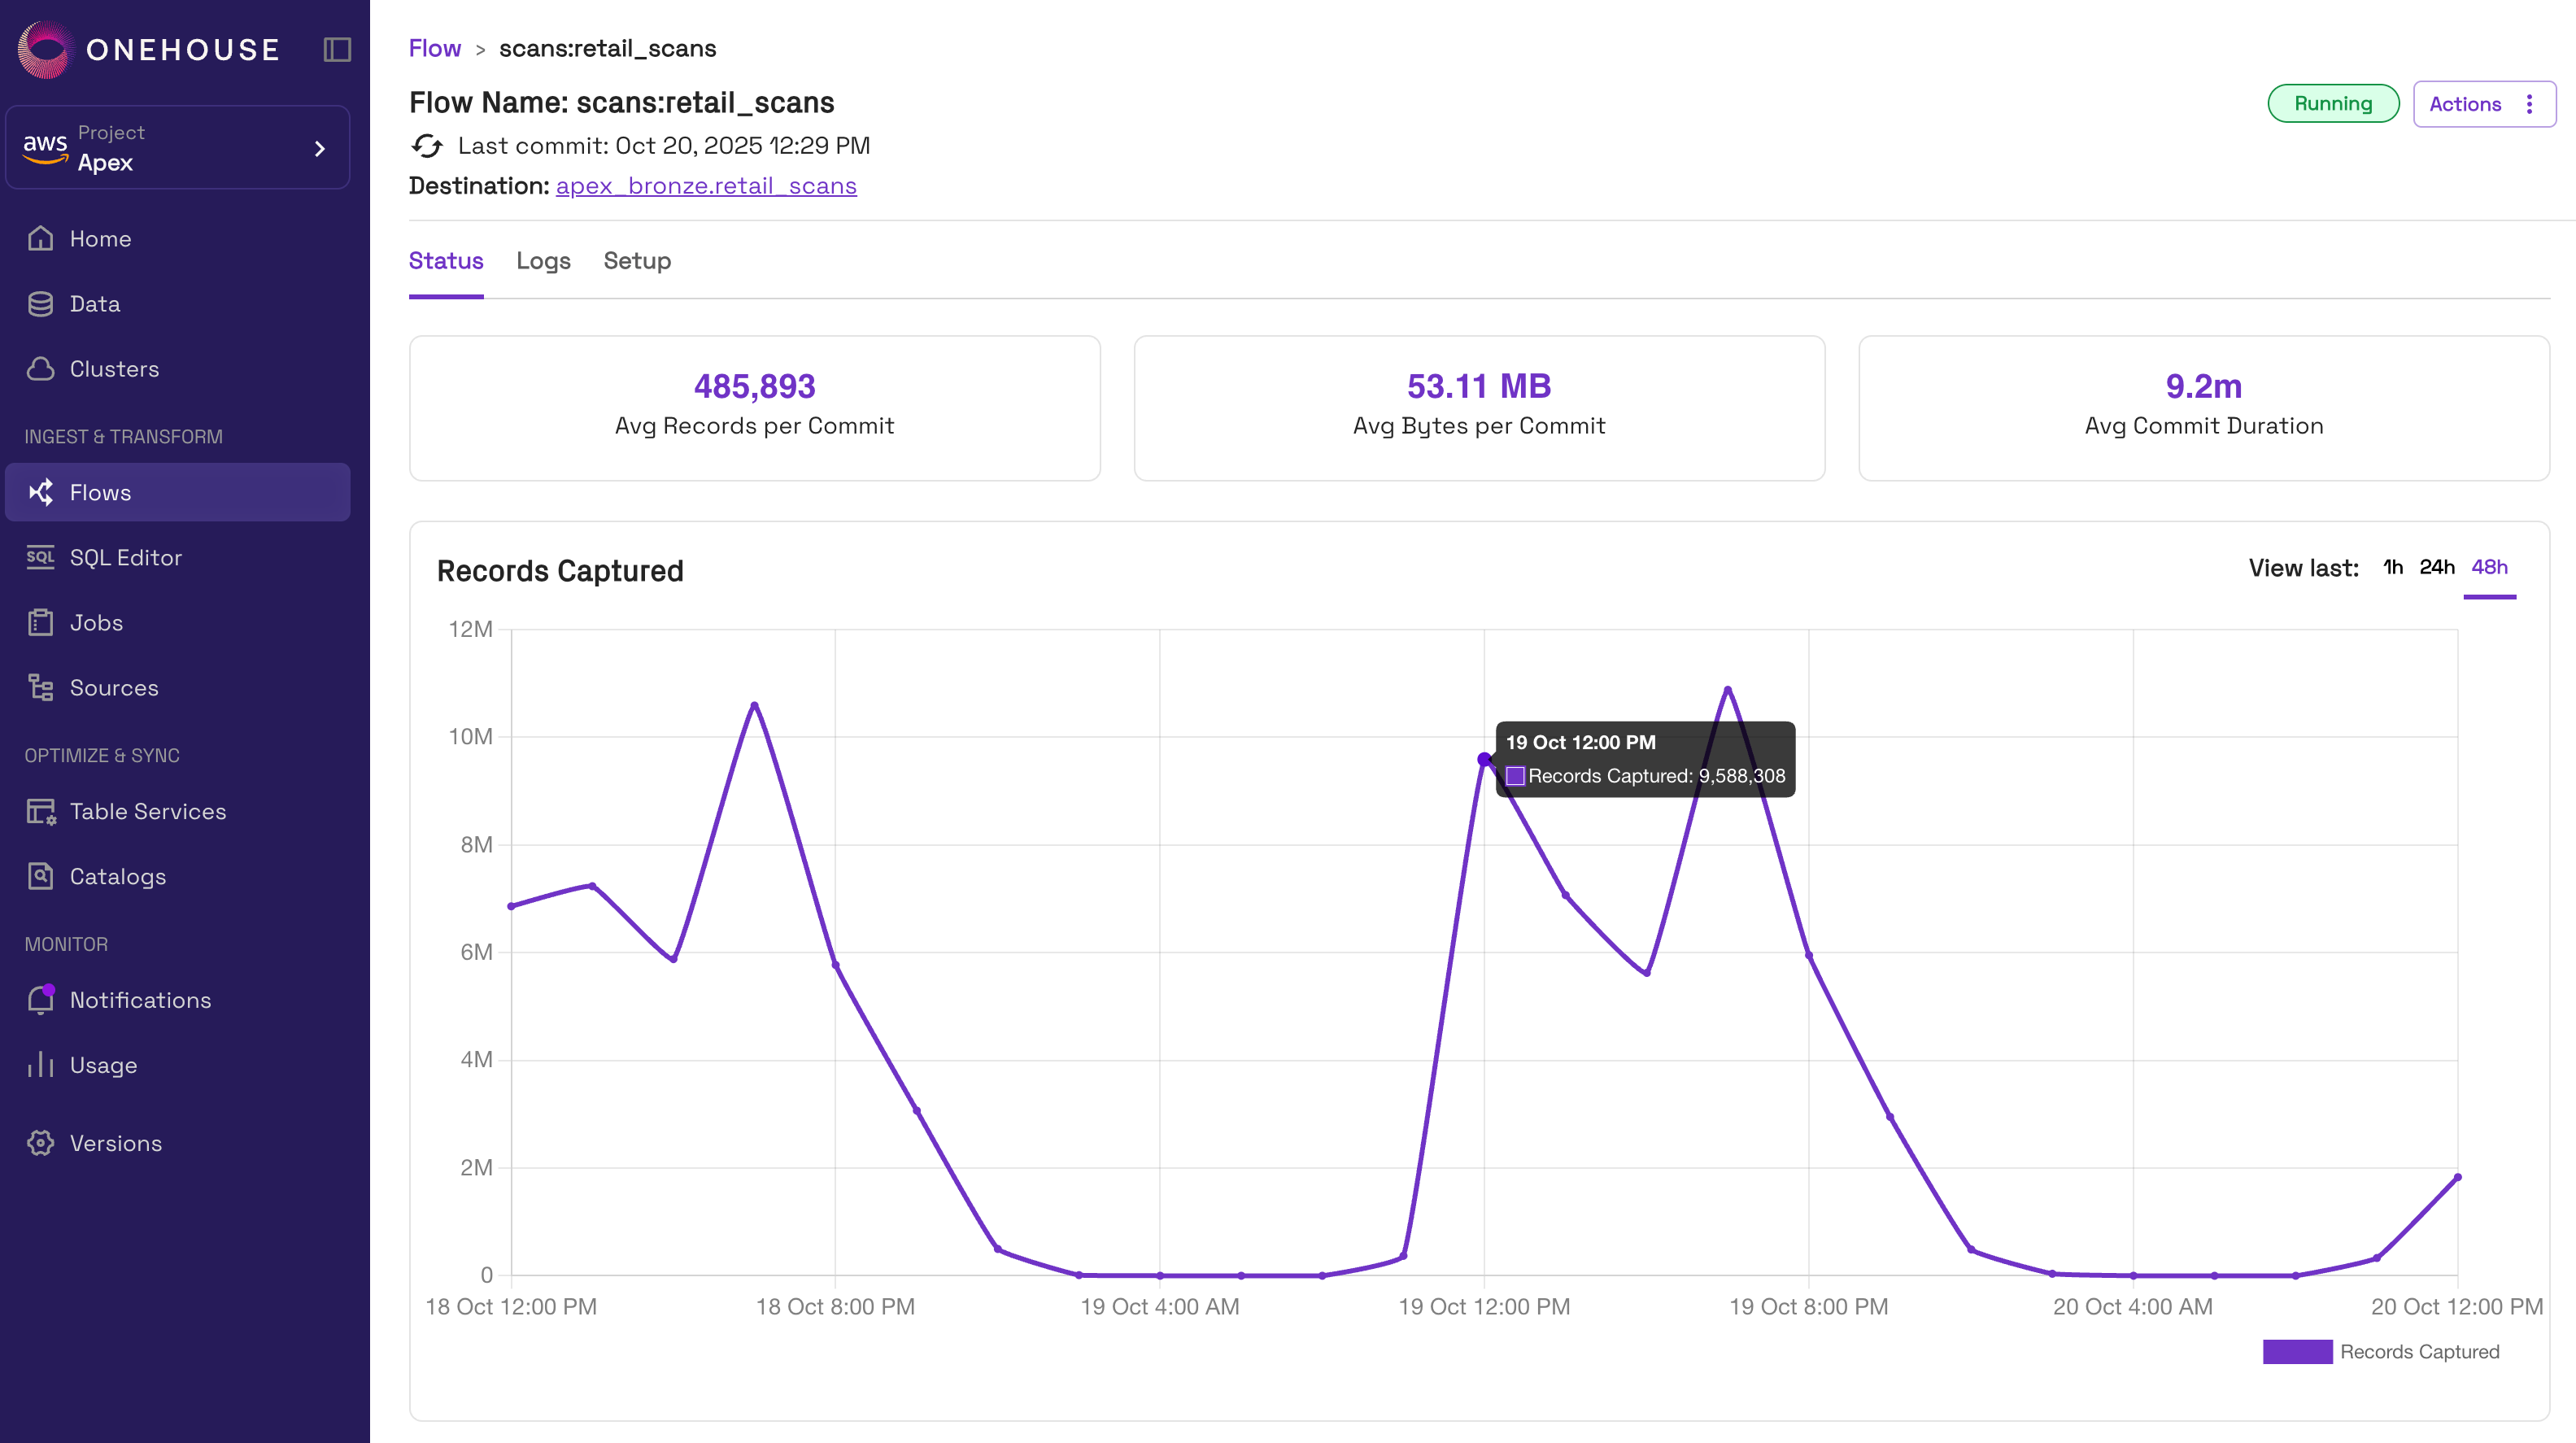
The following metrics and charts are available in the Onehouse console:
| Type | Name | Description |
|---|---|---|
| Metric | Avg Records per Commit | Average number of records in each batch of data committed to the table in a sync |
| Metric | Avg Bytes per Commit | Average data size of each batch of data committed to the table in a sync |
| Metric | Avg Commit Duration | Average time a sync takes to commit data to the table |
| Chart | Records Captured | Number of records captured from the source in the latest sync |
| Chart | Data Pending to Write | Data remaining in the source, not yet captured, after the latest sync; useful for tracking data backlog buildups |
| Chart | Sync Duration | Full duration of the latest sync, including reading, processing/transforming, and writing data |
| Chart | Commit Duration | Full duration of the latest commit; ie. the writing portion of the sync |
Observe downstream tables
While your Flows are running, it can also be useful to monitor metrics for the downstream tables. See the table observability documentation to learn about viewing table history, file sizes, and more.
Notifications
Onehouse sends notifications in the following cases:
- Flow Failed: If a Flow has failed, you will receive a notification. Click into the Flow to view an error message and stack trace in the Onehouse console.
- Flow Delayed: For Flows with the
flow.delayThreshold.numSyncIntervalsadvanced configuration enabled, you will receive a notification when they reach the configured delay threshold.
Notifications will are delivered by email and in the Onehouse console. You can also follow these steps to enable Slack notification delivery.
Advanced Monitoring
Enable advanced monitoring to expose comprehensive metrics about your Flows on a Prometheus endpoint.
This enables you to:
- Dive deeper into Flow metrics with pre-built Grafana dashboards.
- Develop custom alerting rules.
- Integrate with external observability tools, such as Datadog.