In-App Observability
Overview
Onehouse offers rich observability within the Onehouse console to help you monitor your Stream Captures and Tables.
Stream Capture Observability
Click a Stream Capture on the Stream Captures page to view metrics and charts, such as the Average Records per Commit, Records Captured, and Commit Duration. Here is an example of some of the metrics shown:
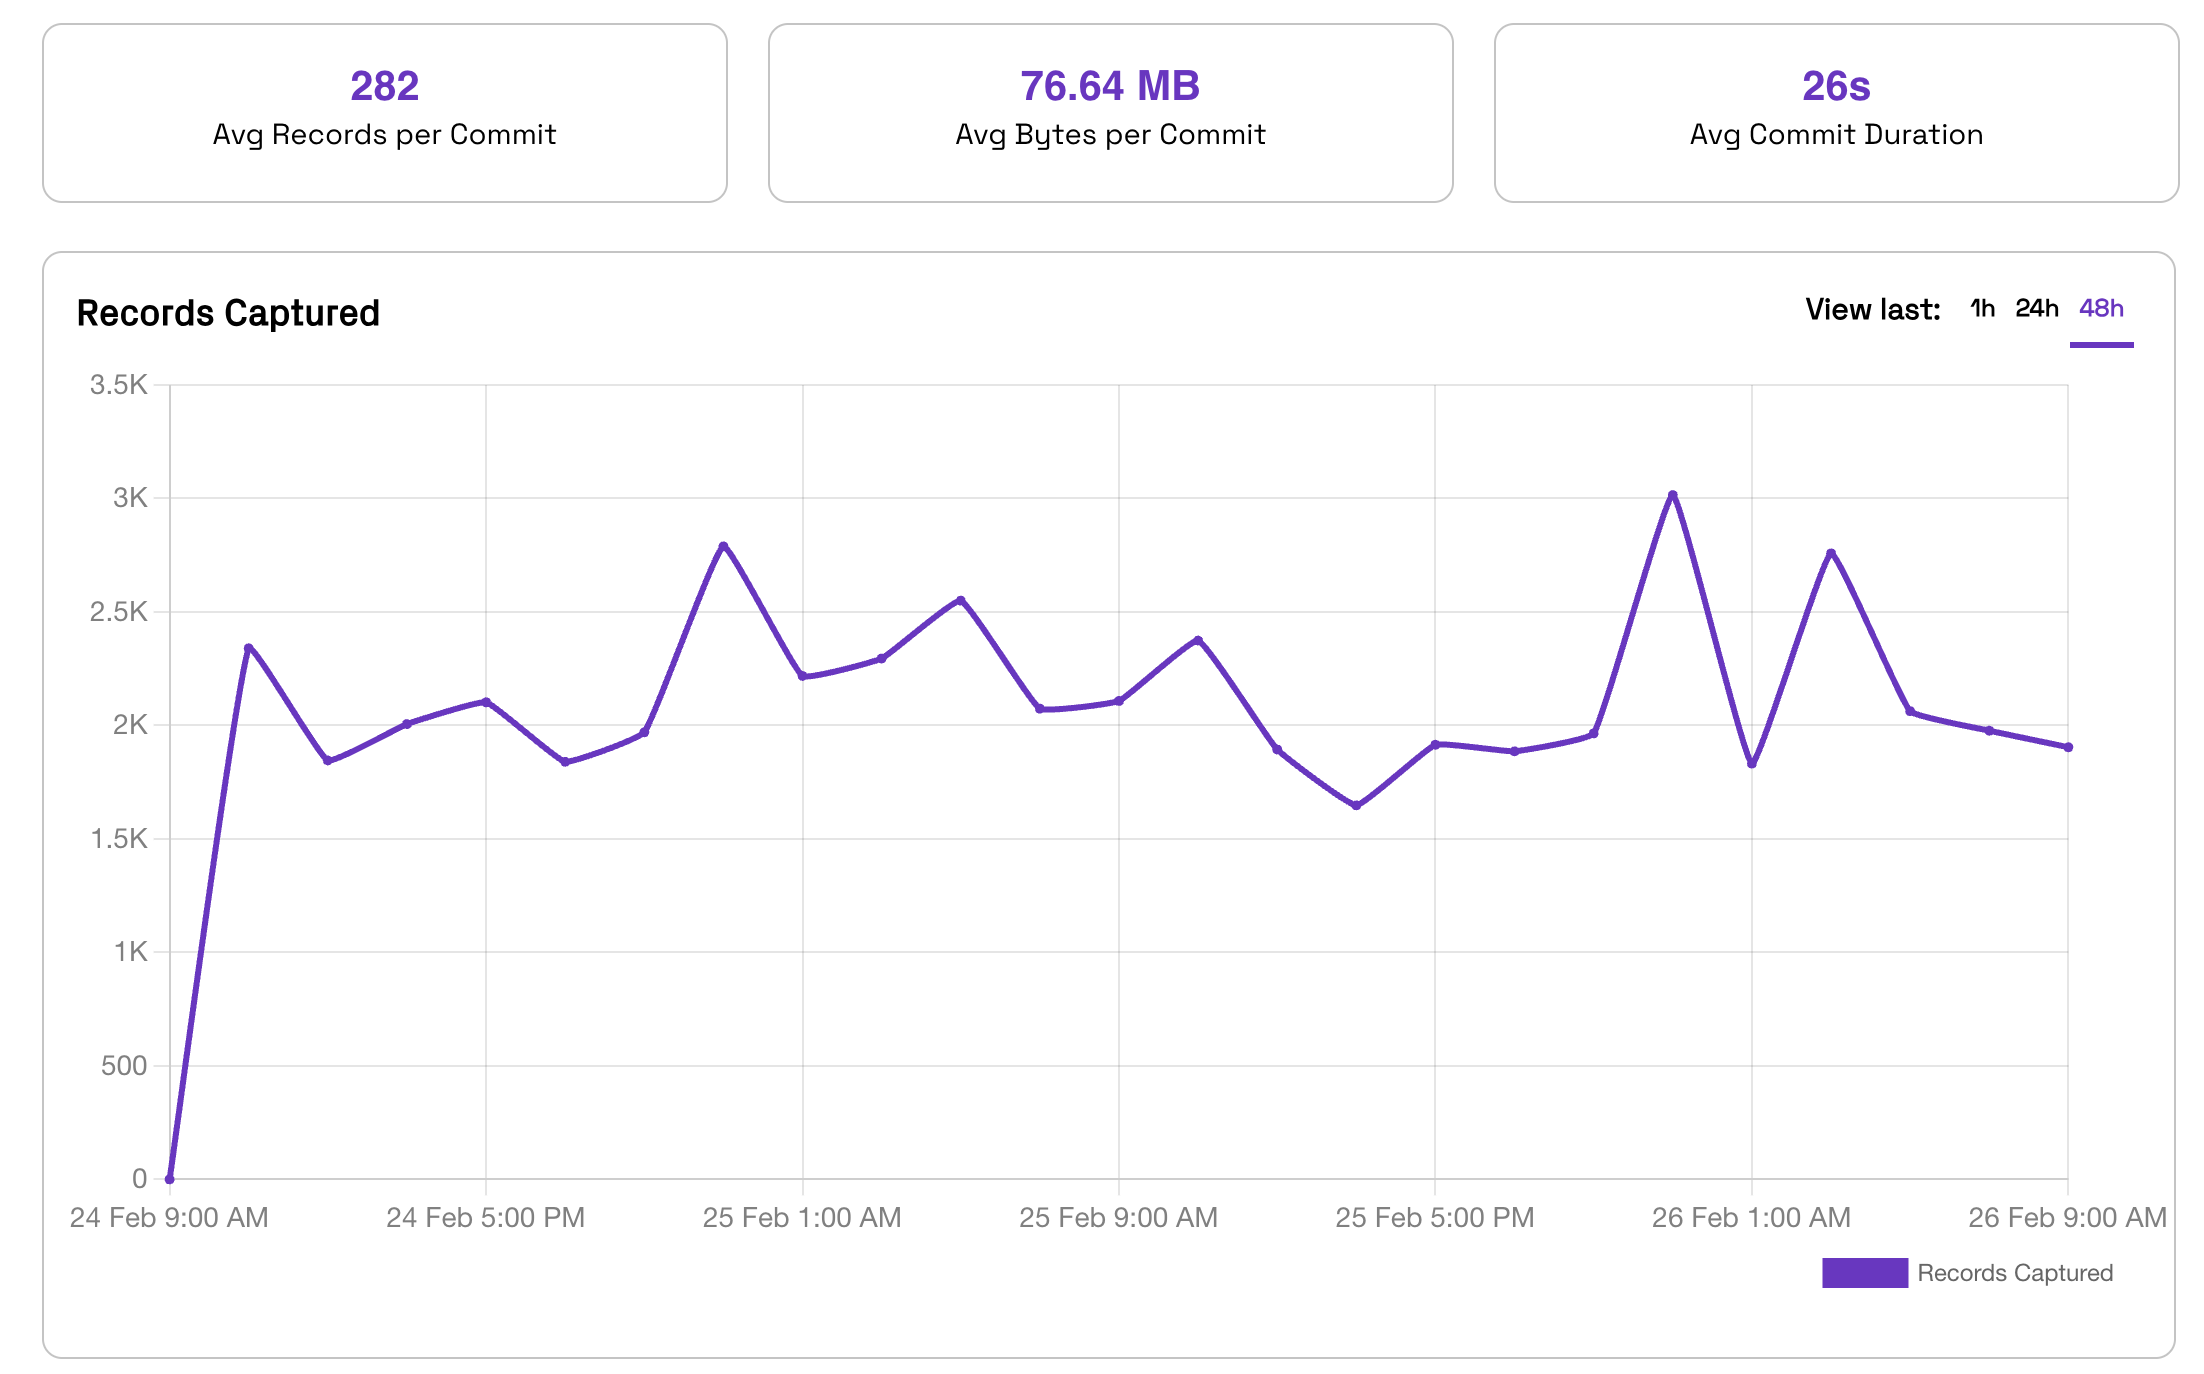
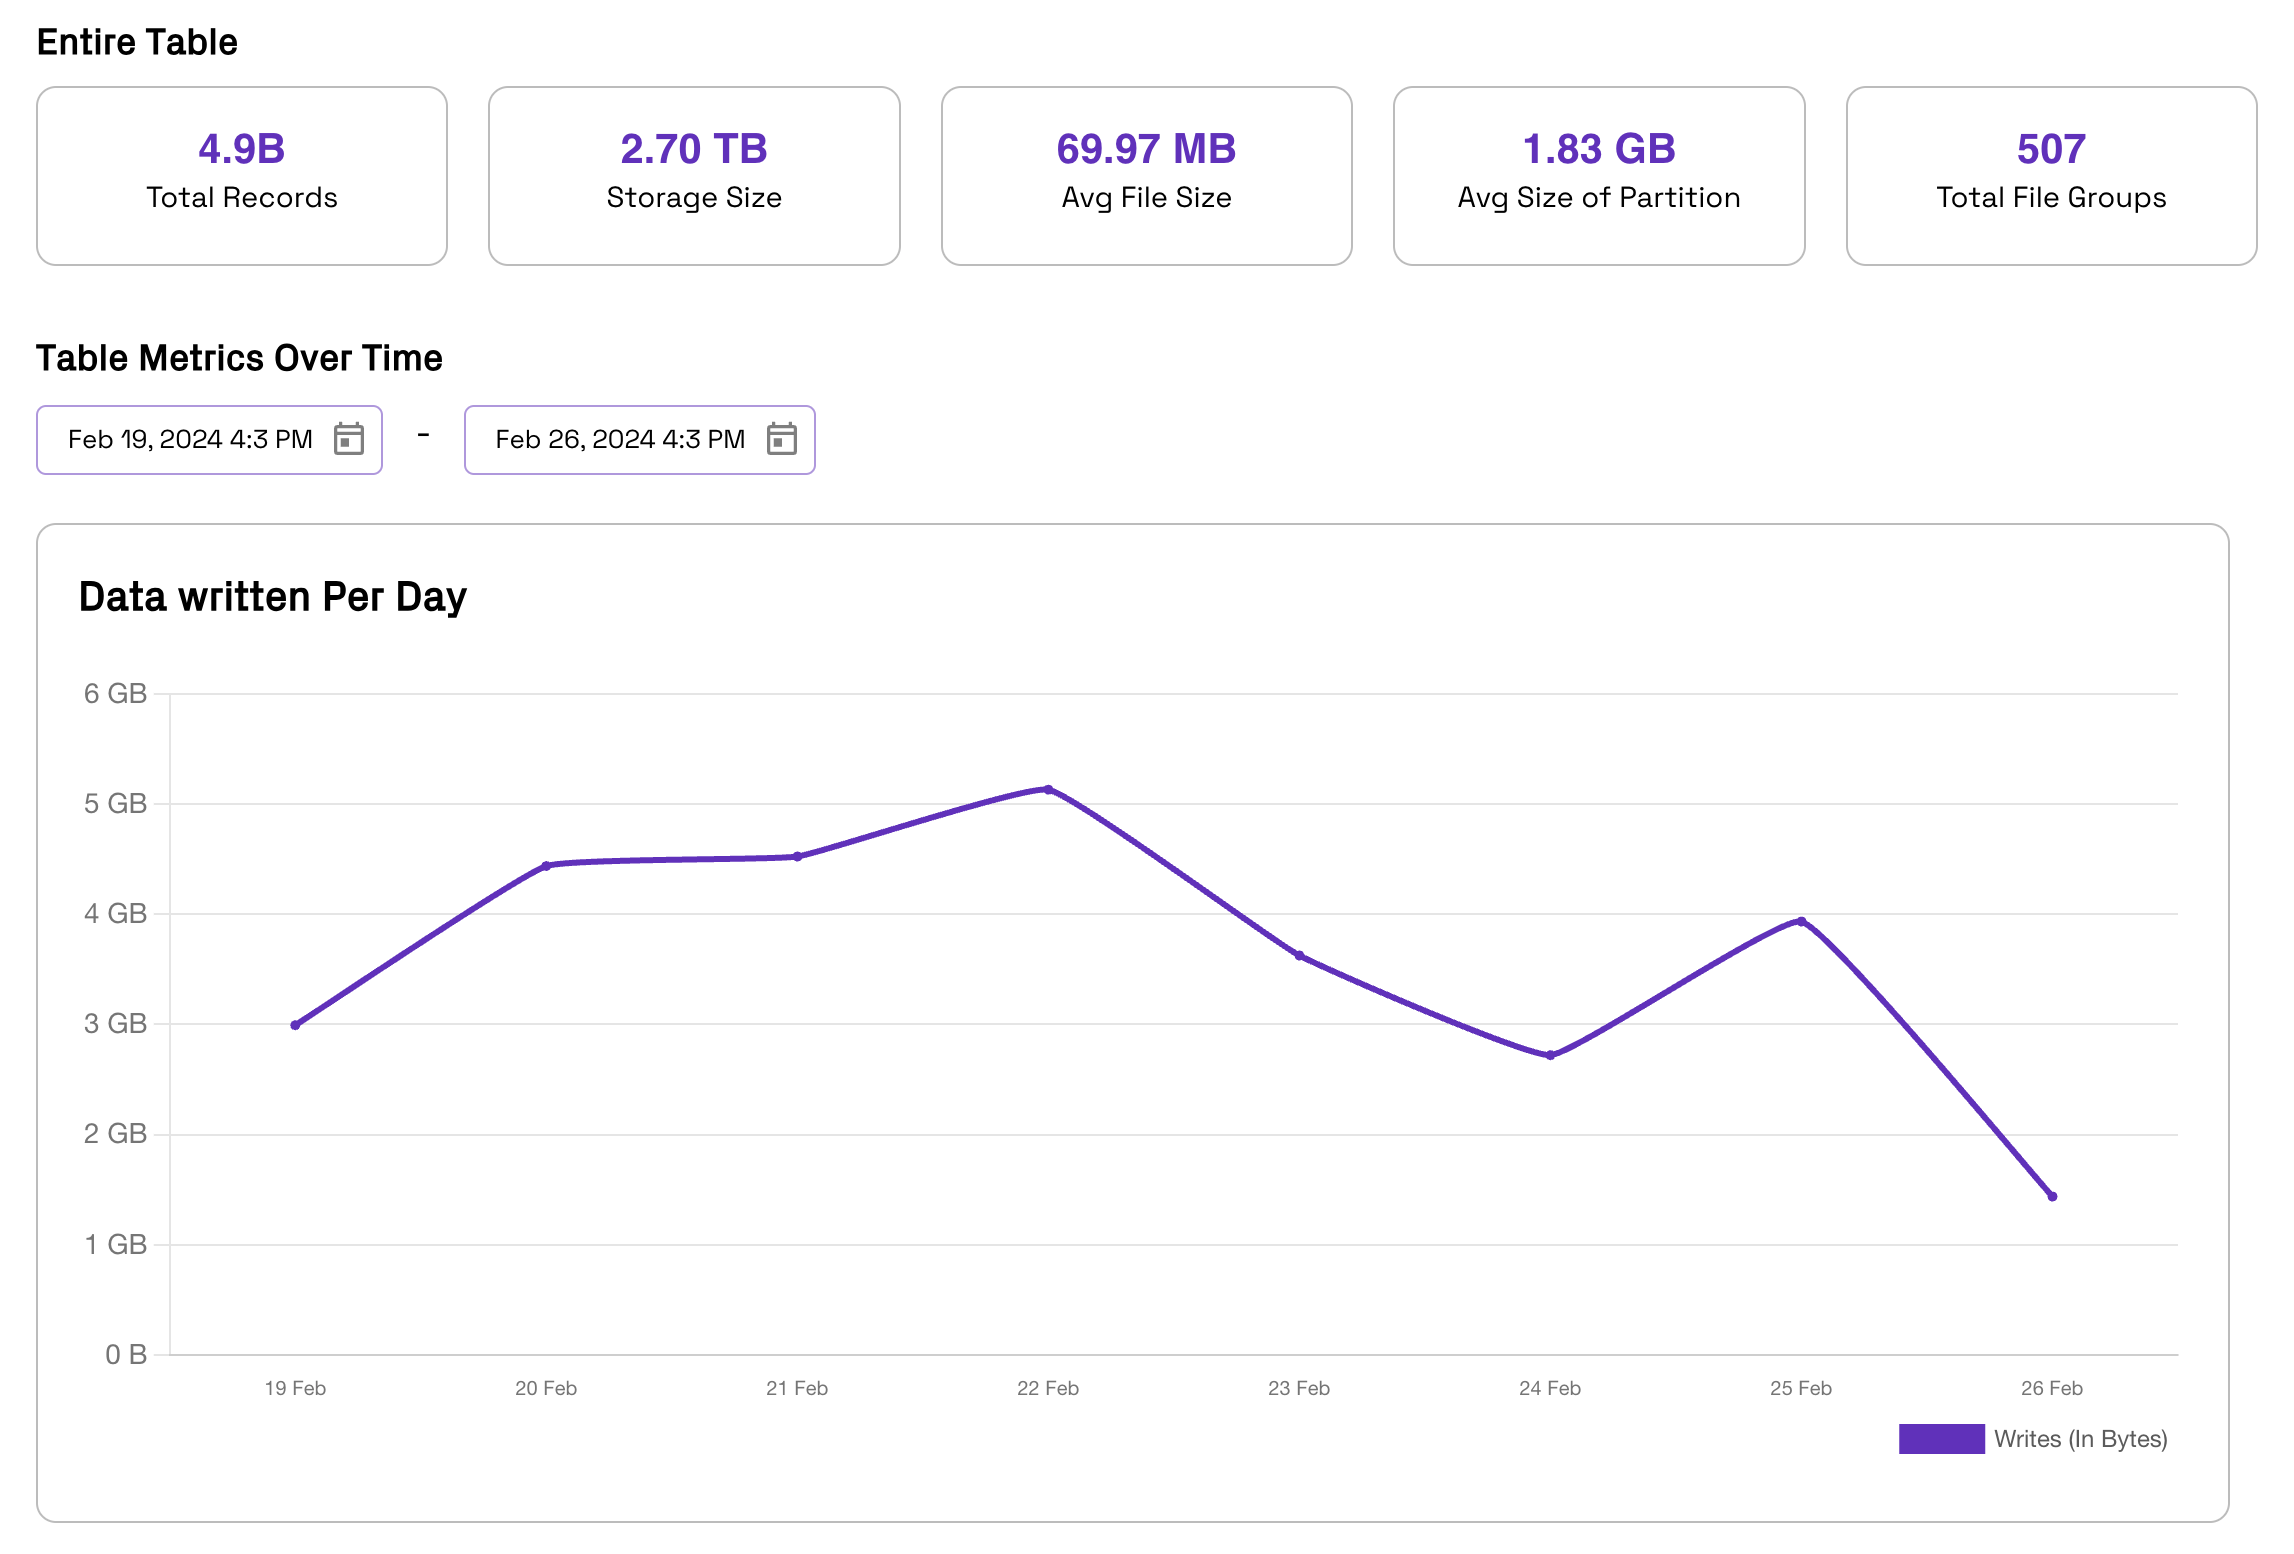
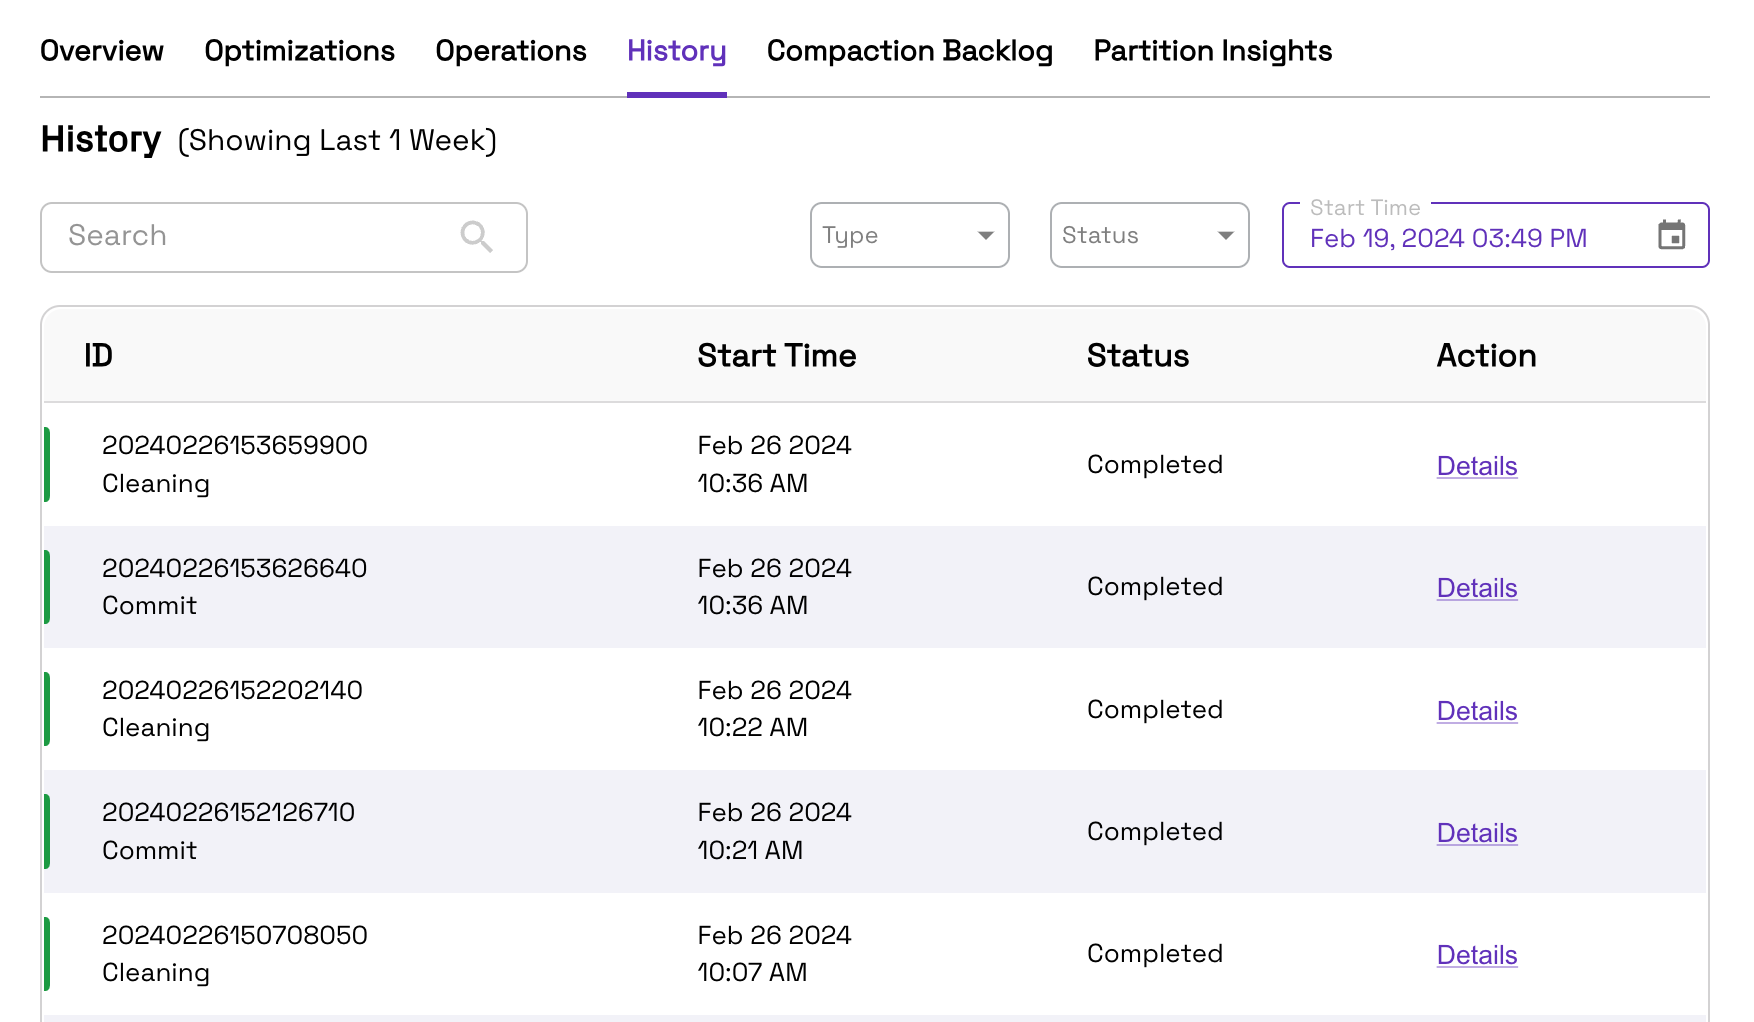
Table Observability
Click a table on the Data page to view metrics and charts, plus the history of actions run on the table. Here is an example of some of the metrics shown on the Overview tab and table action history on the History tab: