Monitor SQL Queries
You can view Apache Spark Driver Logs and Spark UI for each SQL Cluster. In the Onehouse console, open the Clusters page, click into your SQL Cluster, then open the Monitor tab.
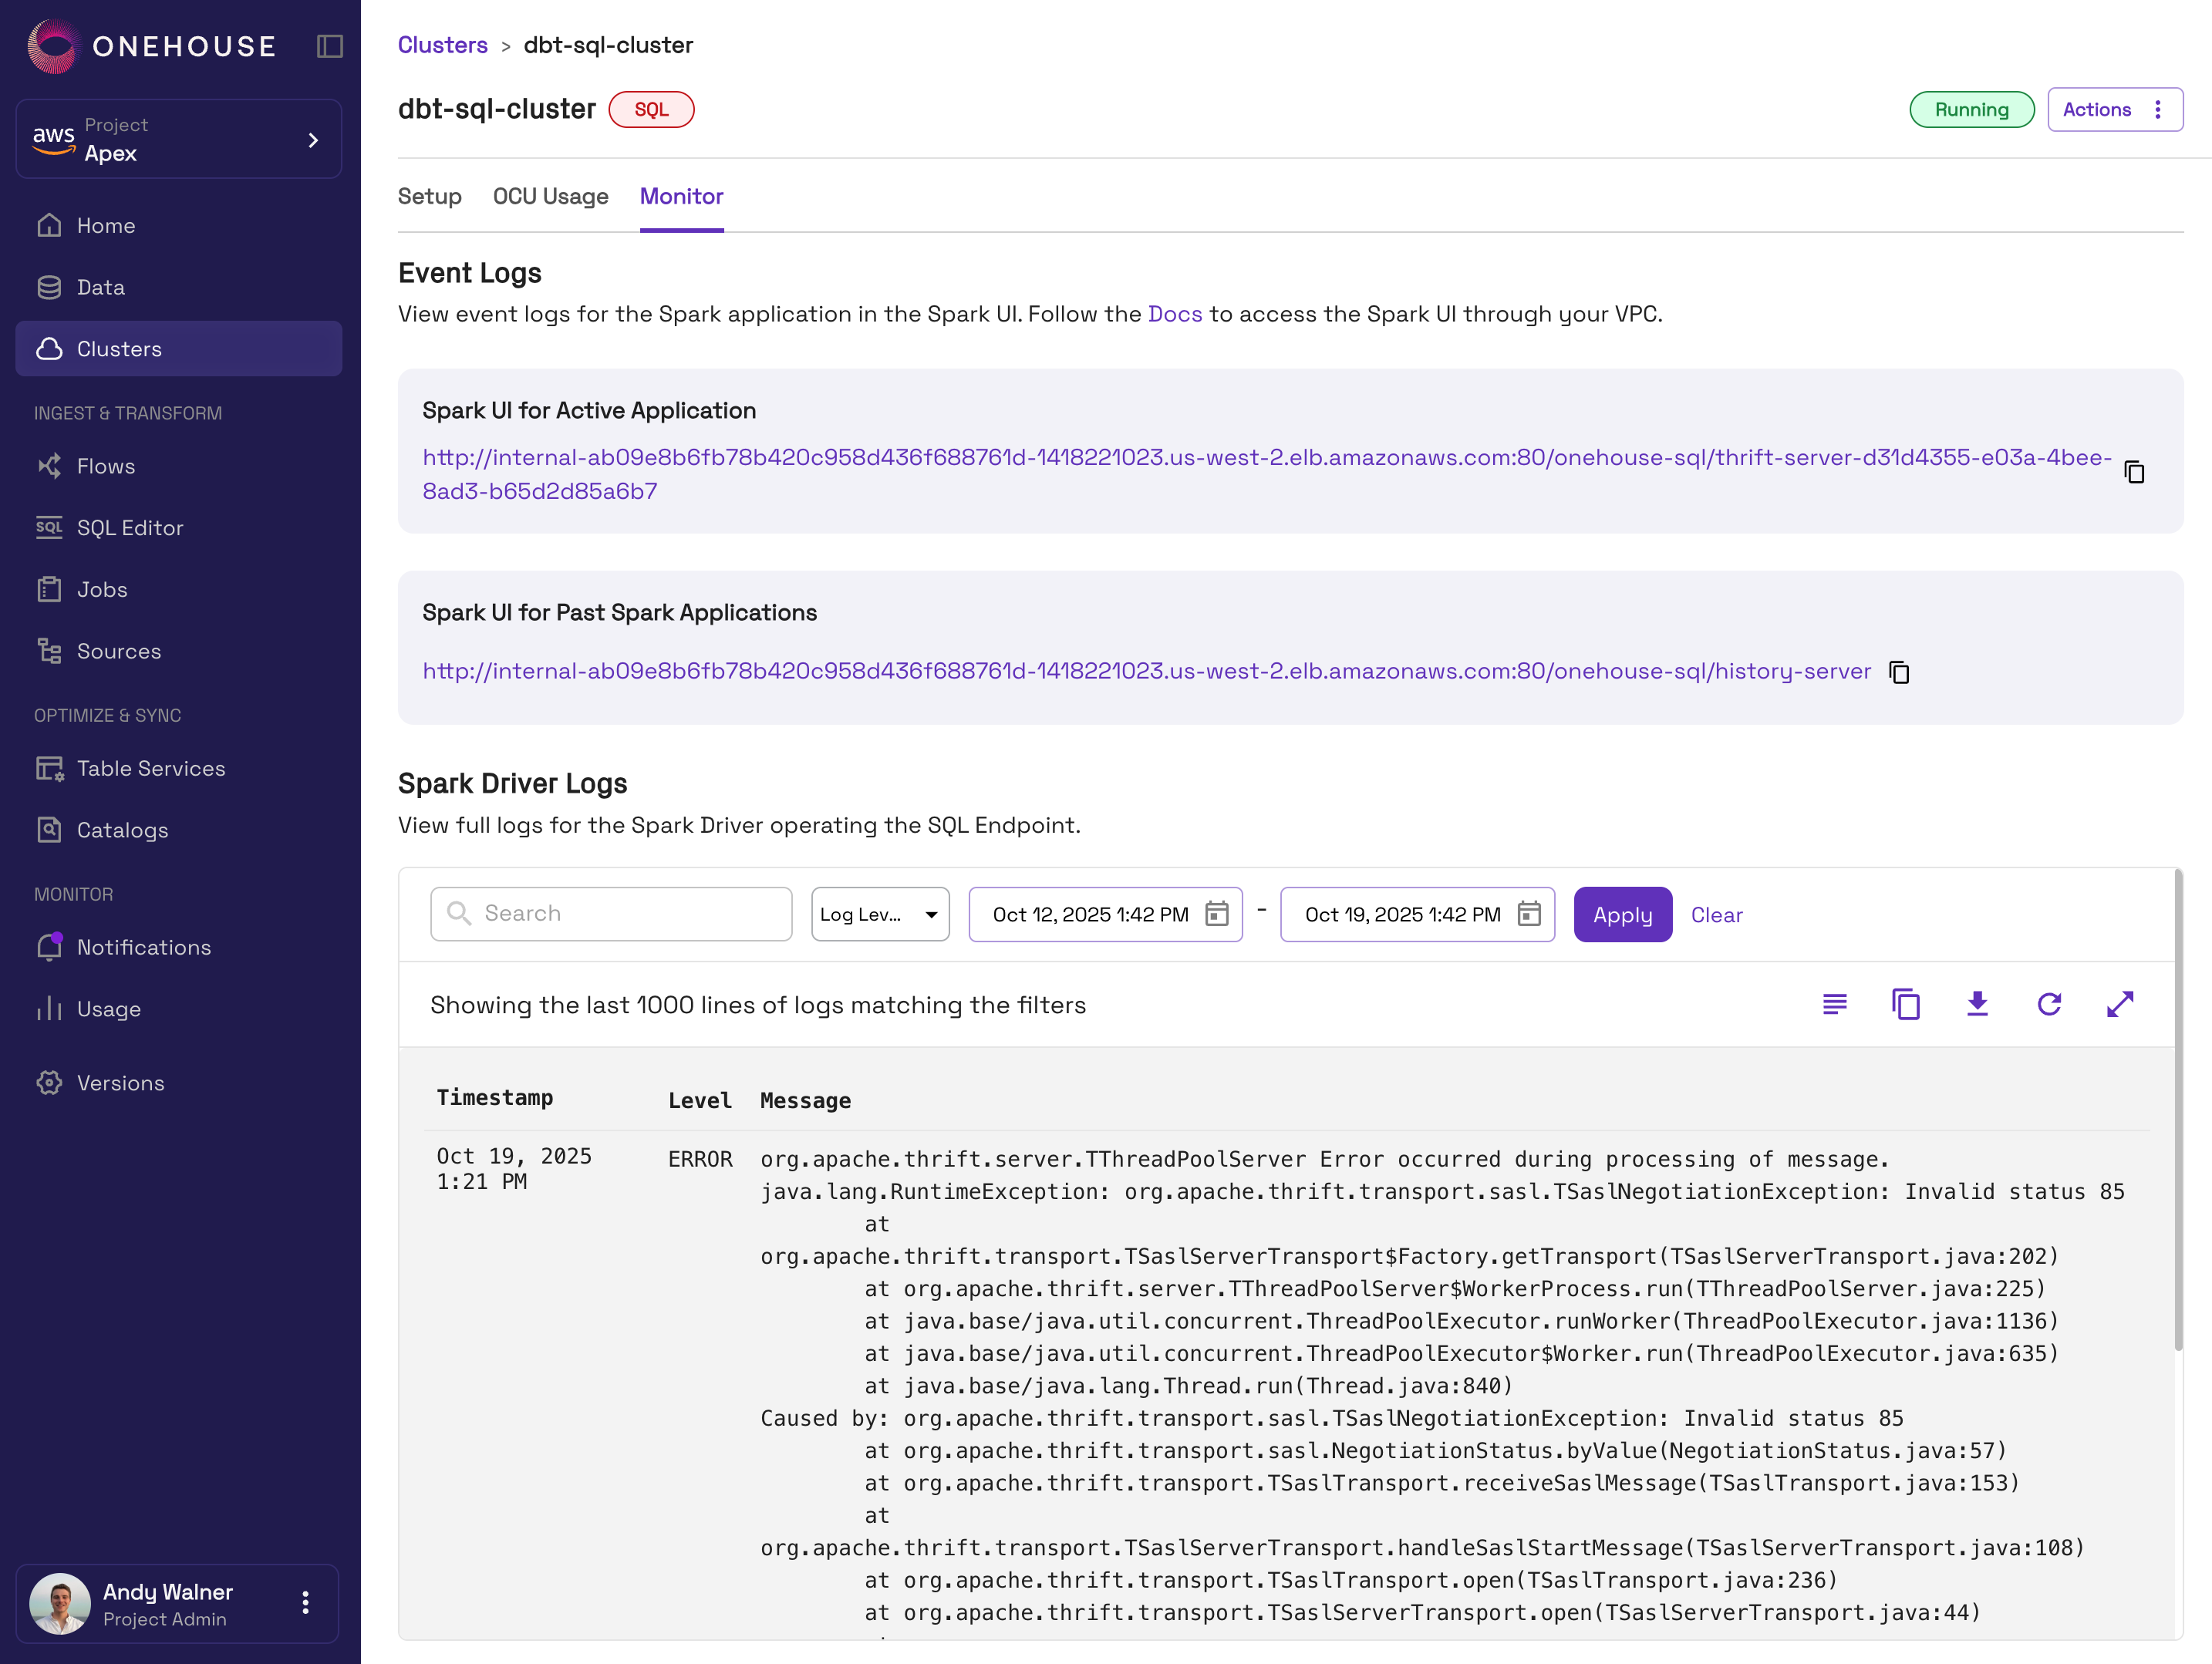
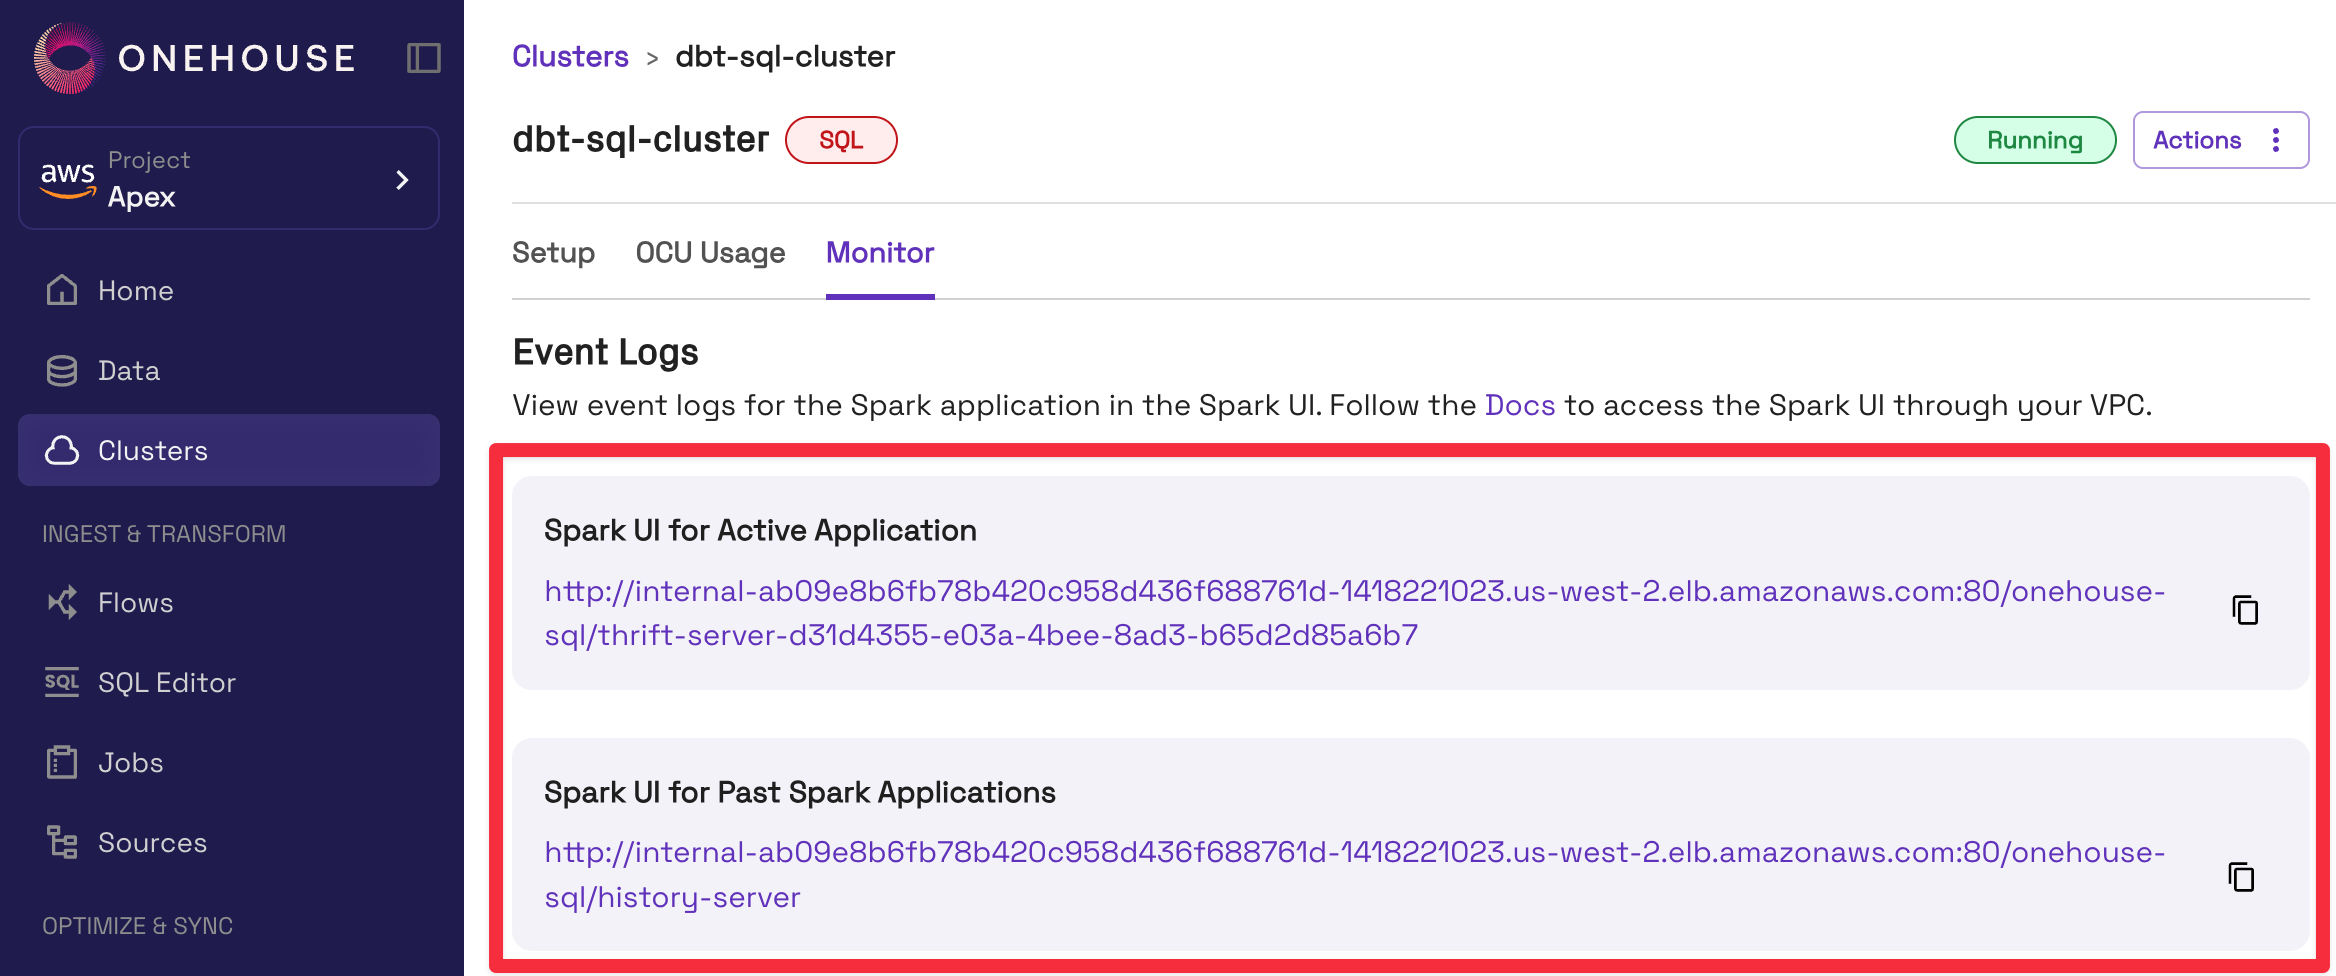
SQL Query Event Logs (Spark UI)
Observability for SQL queries with status, duration, start/finish time, and logical plan are available in the Apache Spark Web UI (aka Spark UI), hosted in your VPC.
Onehouse exposes two endpoints for the Spark UI:
- Active Application: View queries that are actively running or have recently finished.
- Past Applications: View older queries that have been flushed from the active Spark application.
info
Event logs for the Spark UI are retained for 7 days after a query completed or terminated.
Open the Spark UI
- In the Onehouse console, open the Clusters page, click into your SQL Cluster, then open the Monitor tab.
- Find the 'Event Logs' section. Copy the URL for the Spark UI.
- The Spark UI is exposed on an internal load balancer, accessible from within your VPC. Follow these steps to connect to the internal load balancer.
- Note: If public access is enabled, you can skip this step. For projects with public access enabled, the event logs URL will start with
https://dp-apps.cloud.onehouse.ai/.
- Note: If public access is enabled, you can skip this step. For projects with public access enabled, the event logs URL will start with
- After you've connected, enter the event logs URL in your browser to open the Spark UI.
- If you used port forwarding in the previous step, replace the host in the URL with the
localhostforwarded port you configured.
- If you used port forwarding in the previous step, replace the host in the URL with the
- In the Spark UI for the active application, click the SQL / Dataframe tab for detailed information on queries that are currently running.
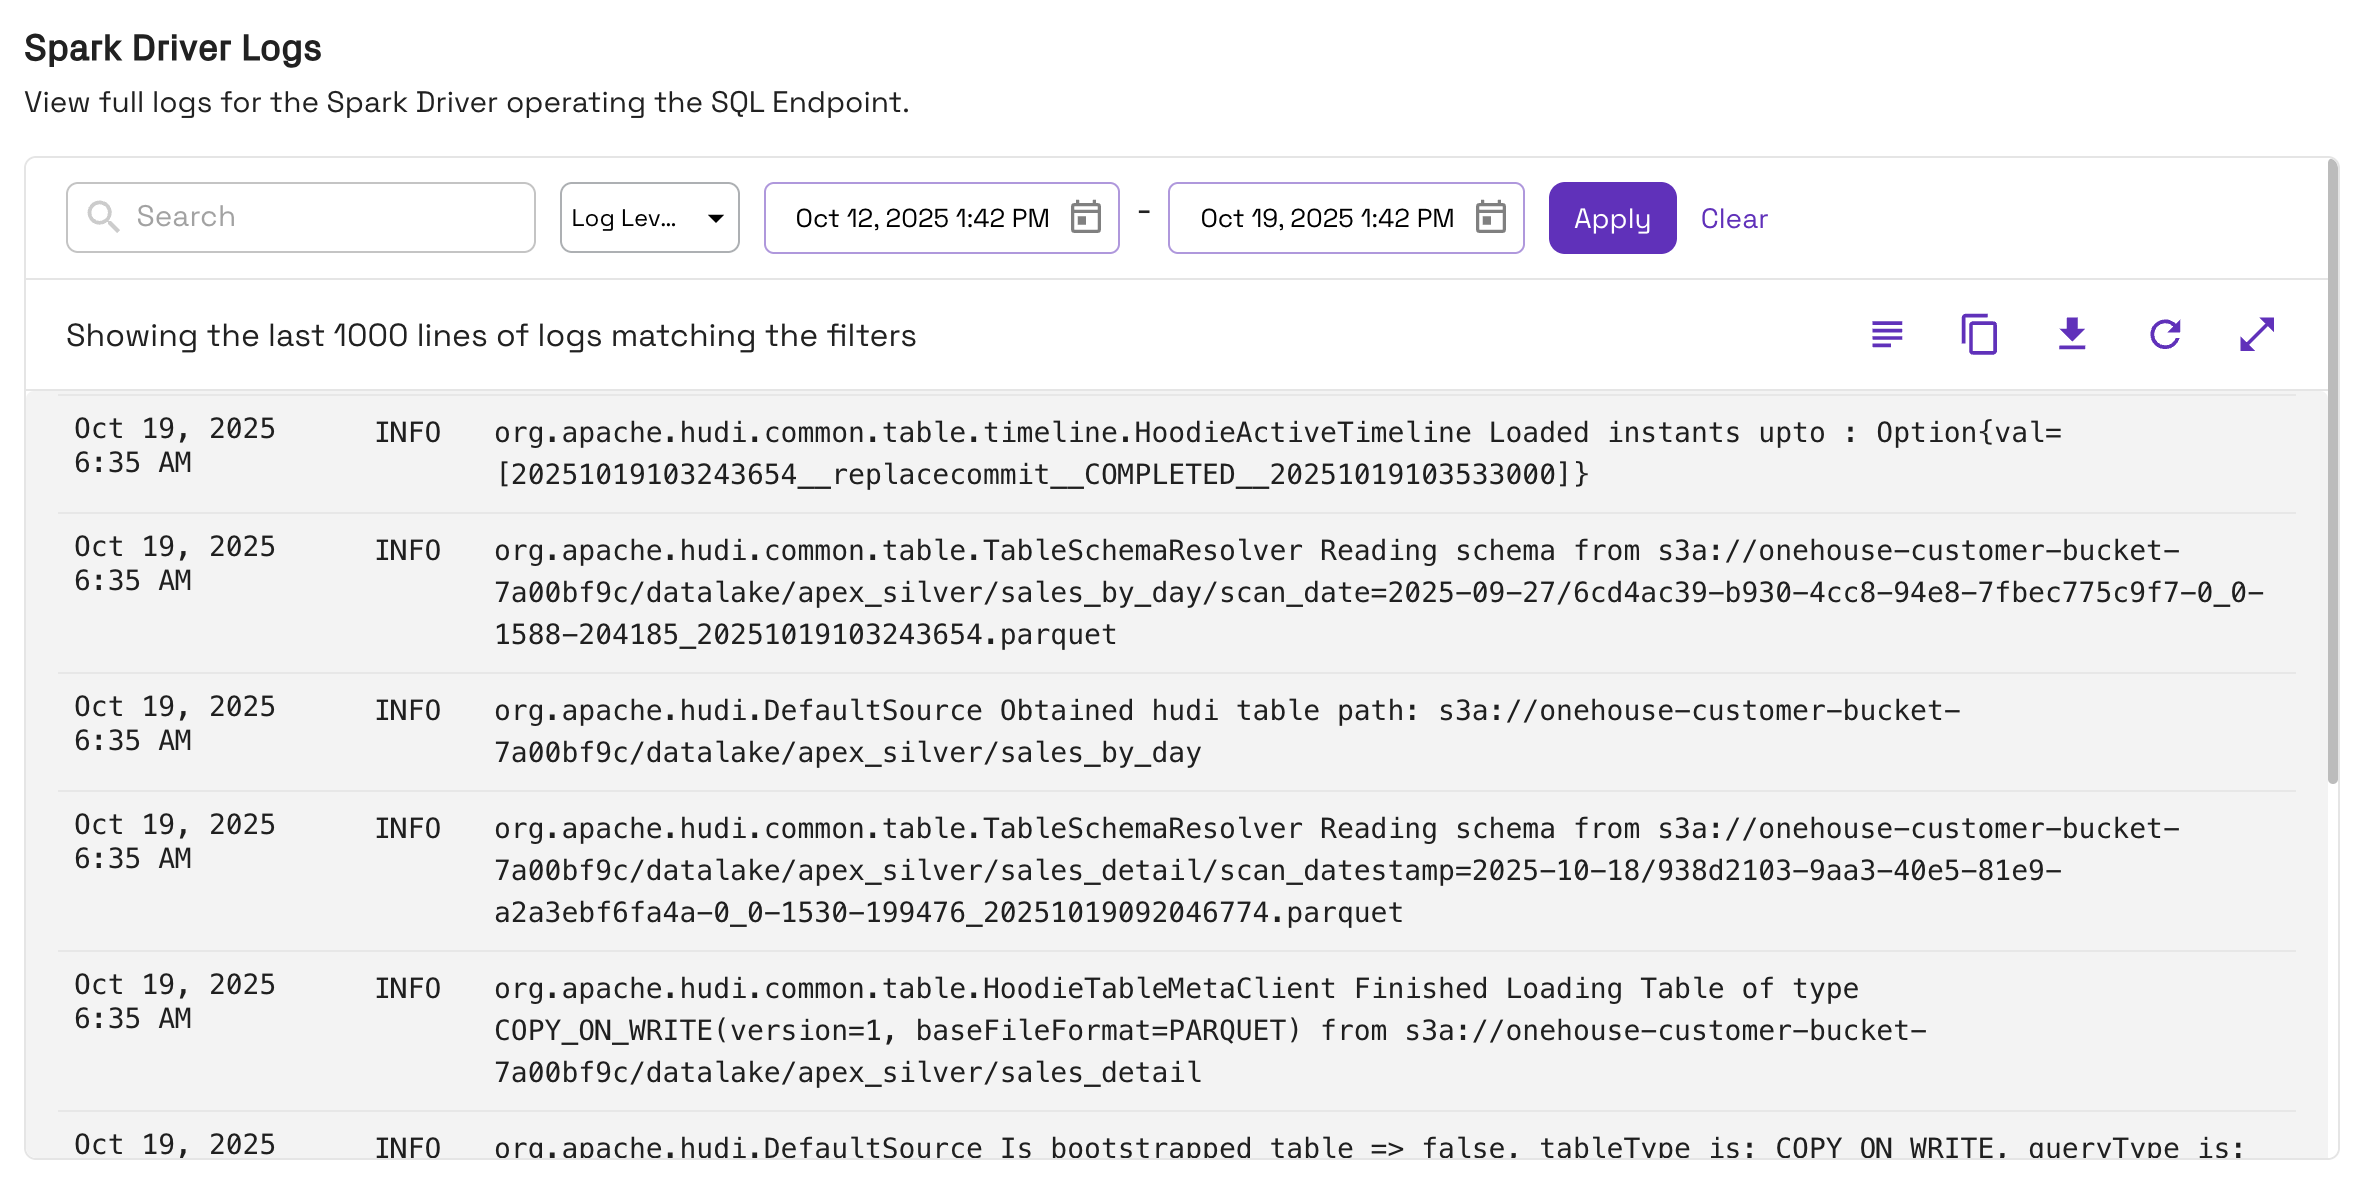
Driver Logs
You can view the Apache Spark driver logs for the SQL Cluster. Each SQL Cluster runs one driver, so the logs from all queries on the Cluster will appear here.
In the Onehouse console, open the Clusters page, click into your SQL Cluster, then open the Monitor tab.