Table Details
Tables are generated either by the Stream Captures you create in Onehouse or discovered as External Tables
Onehouse stores your tables in the structure: Lake > Database > Table. You can browse your tables from the Data tab in Onehouse. Click into a table to see statistics and configurations.
Table details
At the top of the table page, you will see the following details about your table:
- DFS path: The path of the table in cloud storage.
- Partition Key: The fields used for partitioning your table. Partitions help you organize data more efficiently by grouping records together based on a specific partition field.
- Type: Onehouse tables can be type 'MERGE_ON_READ' or 'COPY_ON_WRITE', based on the Apache Hudi table types. Onehouse automatically creates most tables as `MERGE_ON_READ' for optimal performance. Check out this blog to learn more about the table types.
Overview Tab
The Overview tab in the table details page shows charts and statistics about your table.
The first section you may see on the table details overview tab is the table schema and a preview of a few rows of the table. By default this feature is disabled to ensure not even a small sample of your data ever leaves your account. If you want this preview enabled, please contact Onehouse support
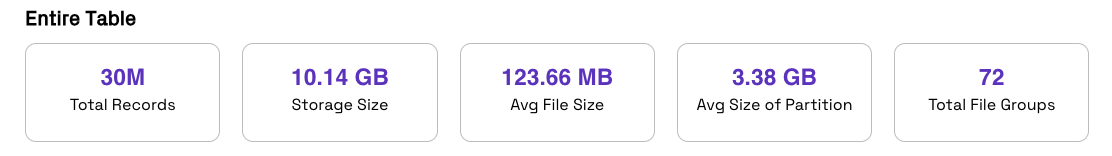
- Total Records = The total records in this table to date
- Storage Size = The amount of storage space used by this table
- Avg File Size = The average size of the parquet files in this table
- Avg Partition Size = The average size of the partitions in this table
- Total File Groups = The total Hudi file groups in this table (more info)
Table metrics over time shows you the total bytes and records ingested over time. The time window shown on the charts can be adjusted with the filters.
Optimizations Tab
Read more about this tab in the Table Services documentation page.
Operations Tab
Savepoint
Savepoints allow you to retain a point-in-time snapshot of the table.
You can trigger Savepoints for a previous commit, or schedule automatic Savepoints on a daily, weekly, or monthly interval.
Set the Savepoint expiry for how long you want to retain each savepoint. A longer expiry will provide you more flexibility to restore the table, but will increase storage costs.
Restore
After creating Savepoints, you can restore the table to a previous Savepoint. This operation will delete all data committed after the Savepoint, and cannot be undone.
You should pause all Stream Captures for the table while performing a restore, since writing to the table will fail during the restore process. Reading from the table may also fail if you attempt to read data committed after the Savepoint.
Data Quality Quarantine
If there is an issue with a row of data (i.e. incompatible schema) we will write that row to a separate quarantine table so your Stream Capture can continue uninterrupted.
The configurations for Data Quality Quarantine are managed within the Stream Capture that writes to the table.
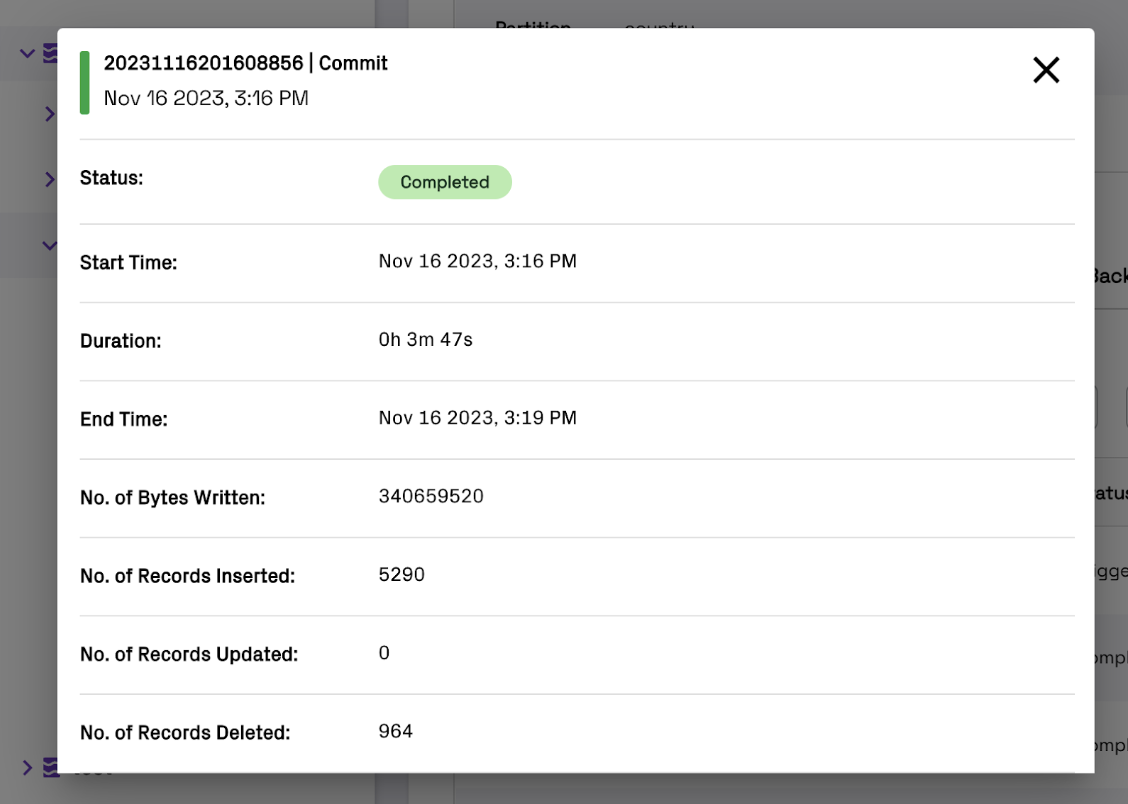
History Tab
The history tab shows a comprehensive list of operations that have written or modified data inside the table for the last 7 days. Commits, cleaning, clustering, compaction, etc are all shown here. You can click 'Details' on an operation to see more fine grained details about any operation.
Compaction Backlog Tab
Compaction Backlog Monitoring (available for Merge on Read tables only) can help you identify log file build-ups that cause out-of-date data, or identify opportunities to optimize your compaction settings.
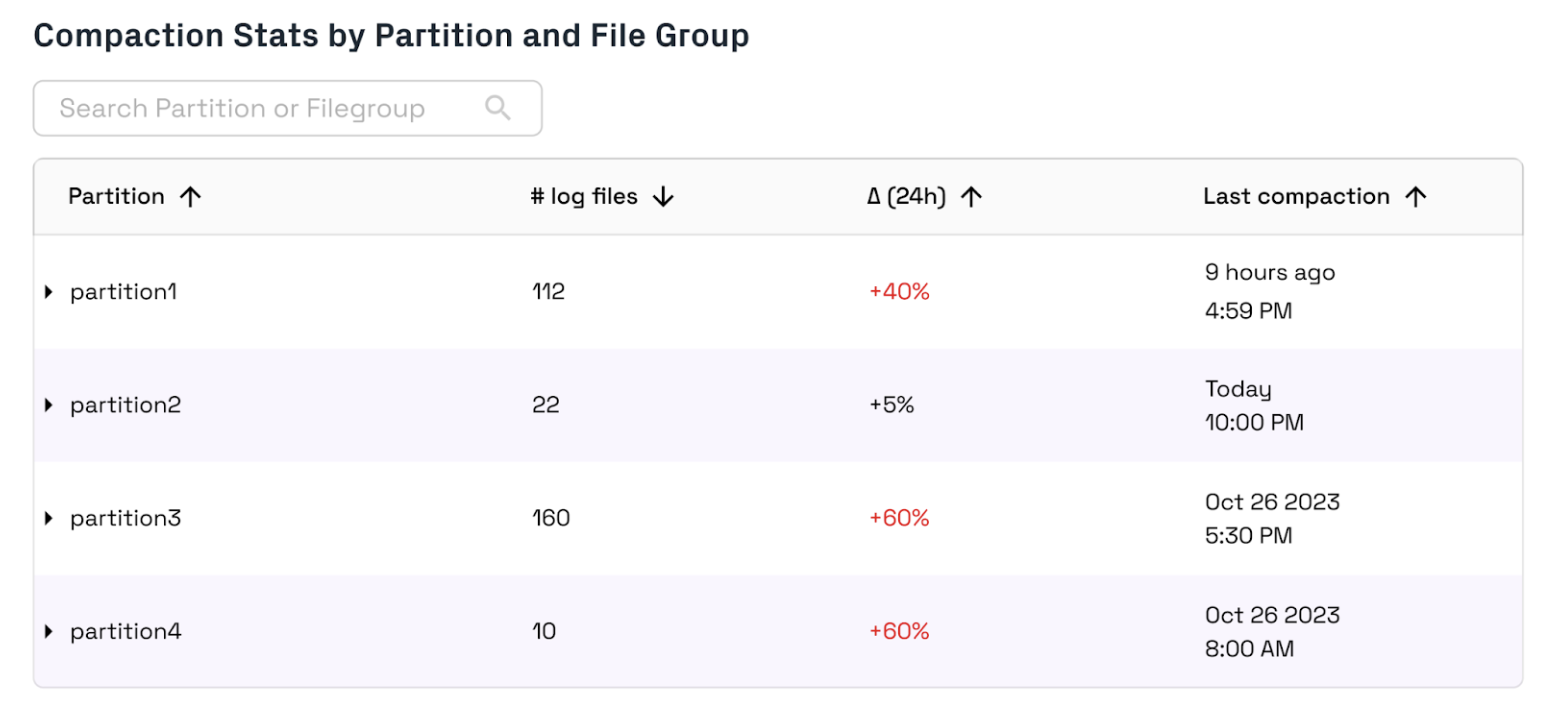
For Merge on Read tables, your real-time views will be outdated if data is not compacted. You can identify uncompacted file groups by checking the number of log files and the time of last compaction. If log files are increasing significantly or compaction has not run in a long time on a file group, you should ensure that compaction is running and consider adjusting your compaction strategy.
Partition Insights Tab
Partition Insights can help you optimize your table performance by improving partition schemes. You may also track partition skew and file size issues that affect performance.
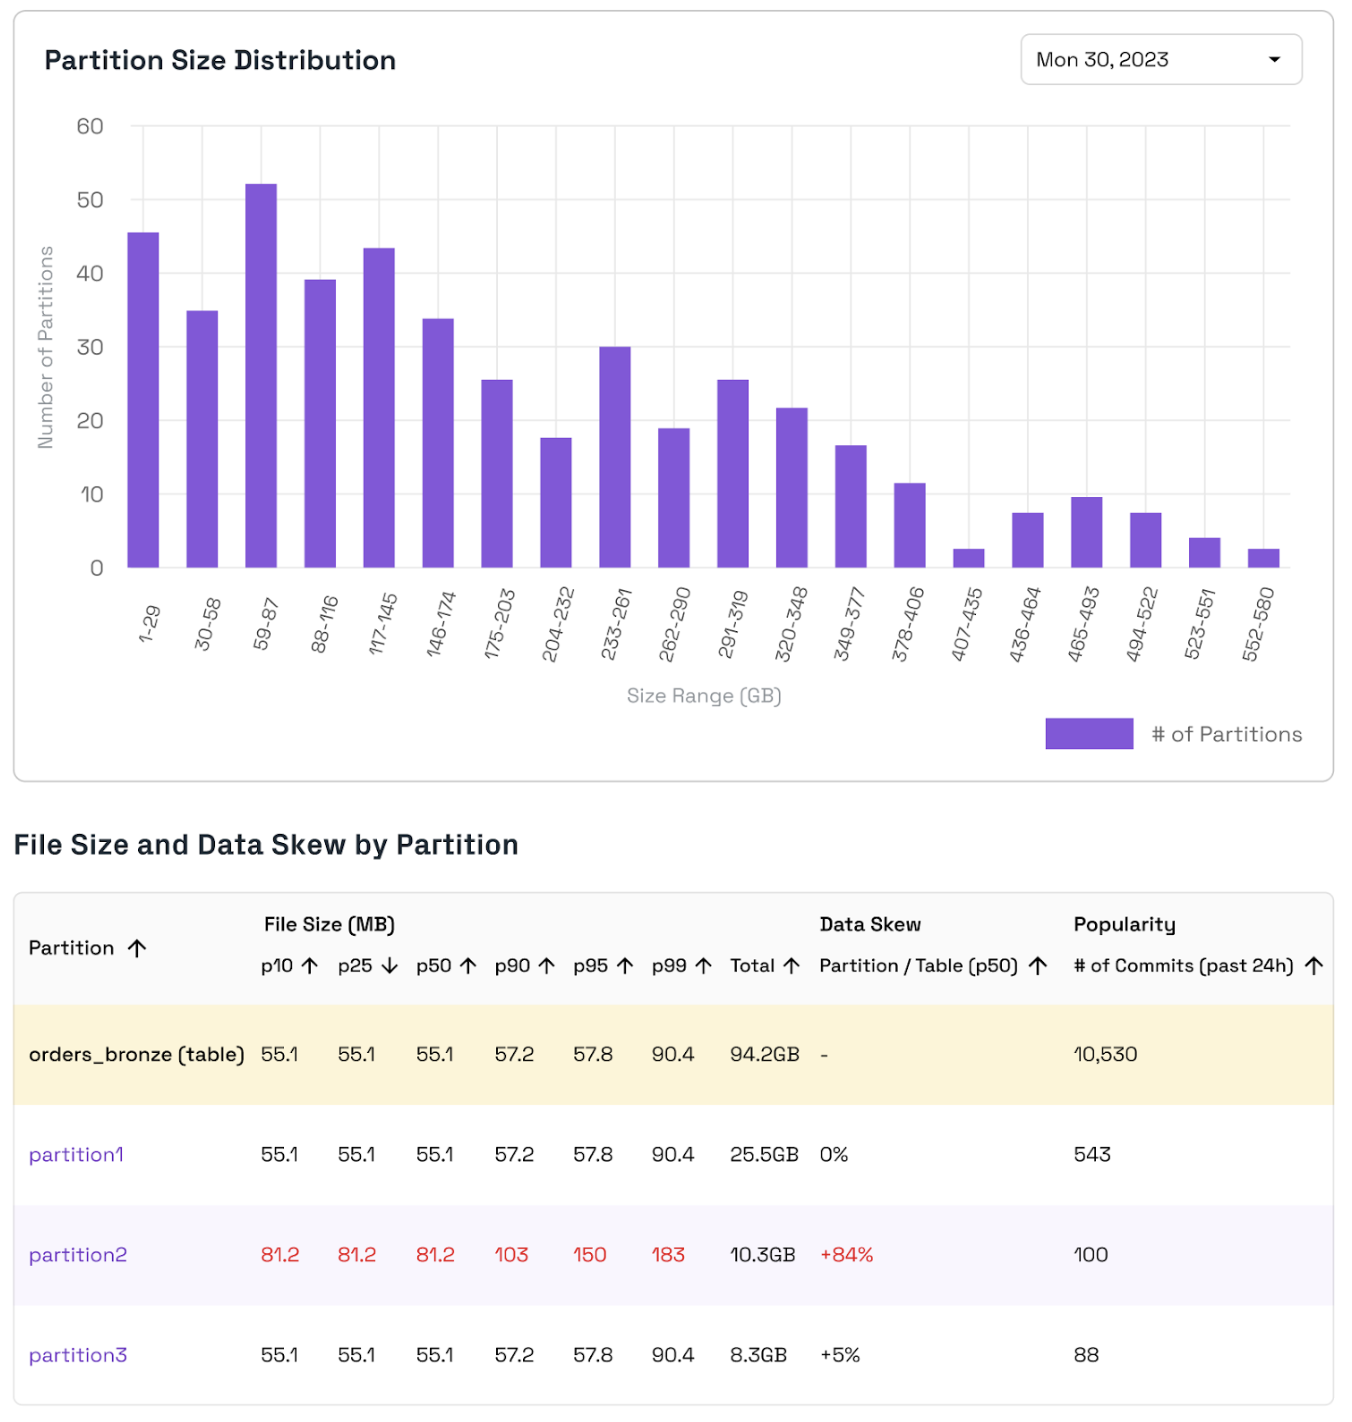
Onehouse provides insights to identify partition sizing inefficiencies. The Partition Size Distribution chart shows the number of partitions that fall into each size range. Ideally, this chart should look like a bell curve with most partitions near the average size and the range (difference between the max and min partition size) should be small. Data Skew indicates if a partition is significantly smaller or larger in total size than the average partition in the table. Onehouse If you find that the Data Skew is high in magnitude for certain partitions, you may reconsider your partitioning strategy to even out partition sizes.
Small file sizes can lead to poor query performance because they require you to scan more files in order to query data. You can use the p10, p50, etc. file sizes to understand if a partition contains small files. If you identify small files, review your file sizing configs and ensure that these services are running properly.